
Anchor Charts: How to Make and Use Them in the Classroom
Anchor charts are large posters that hold one idea, one rule or one strategy where students can see it all day. This guide covers how to plan them, how to build them with a class, and which printed chart sets can save you wall space and prep time.
What anchor charts are and why teachers use them
An anchor chart is a reference that stays on the wall while a topic is being taught. It might show the steps for solving a problem, the parts of a sentence, or a list of rules the class agreed on. The point is that students can look up and find the answer without asking.
A good chart works like a shared memory. When a student forgets how to start a paragraph, the chart is still there. When a new student joins in October, the chart explains what the class already knows.
Charts tend to fall into two groups:
- Built charts: made live with the class during a lesson, in your handwriting and the students’ words.
- Printed charts: made ahead of time, such as an alphabet strip, a shapes display or a weather chart.
Both have a place. Built charts hold the thinking of the moment. Printed charts hold facts that never change, so there is no reason to redraw them each year.
How to plan anchor charts before you teach
A chart that is planned in advance looks cleaner and says more. A little thought at the desk saves a lot of crossing out at the easel.
Pick one idea per chart
A chart with three topics on it is hard to read from the back row. If the lesson has three parts, make three charts and hang them side by side.
Decide the layout first
Sketch the chart on scrap paper. Where will the title go? How many columns do you need? Leave room at the bottom for examples that students add later.
Choose a color code
Use the same colors for the same jobs across the year. For example, black for the main idea, blue for examples and green for a tip. Students begin to read the colors without being told.
Write big and plain
Print in clear block letters, at a size that can be read from the far side of the room. Keep the wording short. A chart is for glancing, not for reading a paragraph.
Building anchor charts with your class
A chart built with students gets read more often than one that simply appears on the wall. Students remember adding to it, and they trust it more.
- Start with a title and a question. Write the topic at the top, then ask students what they already know.
- Add ideas as they come. Write the student’s words when you can. Use your own words only to tidy a messy idea.
- Add an example. A rule with no example is easy to misread. Put one short, correct example under each point.
- Read the finished chart aloud together. This shows students how to use it.
- Hang it where it will be needed. A chart about writing belongs near the writing table, not behind the door.
Charts that are never revisited turn into wallpaper. Point to the chart during the next lesson, and ask a student to find the step they need. That small habit teaches students to look before they ask.
Anchor chart ideas by subject
Here are some chart ideas you can build in any classroom. Each one holds a single idea, with examples you can check at a glance.
Language arts
- Nouns, verbs and adjectives: three columns with two words in each. For example, book and garden as nouns, read and plant as verbs, tall and green as adjectives.
- Parts of a paragraph: a topic sentence, supporting details and a closing sentence, shown as a stack of boxes.
- Steps for sounding out a word: look at the first letter, say each sound, blend the sounds, then check that the word makes sense.
- Reading strategies: a list of moves a reader can try when a text gets hard. Our post on reading comprehension strategies has ideas you can turn into a chart.
Math
- Place value: a chart with hundreds, tens and ones, and the number 352 split into 300, 50 and 2.
- Ways to show addition: a number line, a ten frame and a written sentence, all for the same problem, 7 + 5 = 12.
- Shapes and their sides: a triangle has 3 sides, a square has 4 equal sides, a pentagon has 5 sides and a hexagon has 6 sides.
- Telling even from odd: a number is even if it can be split into two equal groups, such as 8 into 4 and 4.
Science
- Steps of an experiment: a question, a guess, a test, what we saw and what we learned.
- A weather record: a chart where the class marks the day’s conditions.
- Parts of a plant: roots, stem, leaves and flower, labeled on a simple outline.
Classroom life
- Morning routine: hang up the bag, turn in homework, pick up a pencil, start the warm-up.
- Kind words we can use: a short list that students add to over the year.
- What to do when you are stuck: reread, ask a partner, try a different way, then ask the teacher.
Printed anchor charts that save prep time
Not every chart needs to be drawn by hand. Some references stay the same all year, and a printed version looks tidy and is ready the moment you hang it. Here are four sets from our shop that work as wall references.
- The Classroom Charts Bundle gathers four chart sets in one download: classroom jobs charts, a weather chart and a transportation chart. It has 162 pages in all.
- The Alphabet and Number Posters set has 41 printable posters for tracing alphabet letters and numbers from 0 to 9. You can display them as wall references or laminate them for reusable dry-erase practice.
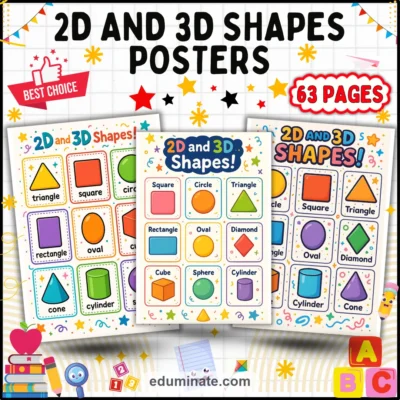
- The Shapes Posters set has 60 visual charts showing two-dimensional and three-dimensional figures. Hang each chart on a bulletin board, or hand out mini versions for student math folders.
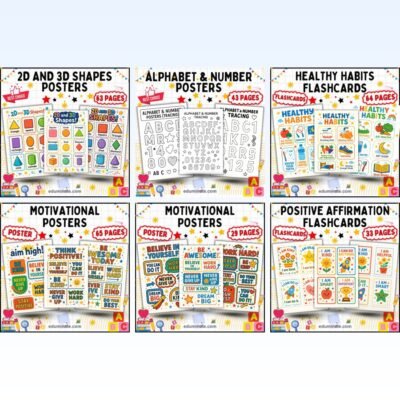
- The Classroom Posters Bundle brings six poster and card sets into one download, covering shapes, alphabet and number, healthy habits and motivational posters plus affirmation cards. It has 297 pages.
Using printed sets for the fixed facts leaves your marker time for the charts that need student voices.
A classroom jobs chart and a weather chart
Two of the most useful charts in a room are the jobs chart and the weather chart, because students touch them every day.
A classroom jobs chart lists each task and the student who holds it this week. Jobs might include line leader, door holder, board cleaner, paper passer and plant helper. Rotate the names on a set day so every student gets a turn, and keep the chart low enough for students to reach.
A weather chart gives the morning meeting a clear start. A helper looks out the window, picks the matching card and places it on the chart. Over a few weeks the class can look back and count how many sunny, cloudy or rainy days they have recorded. That is a quick, real data set for a math or science talk.
Both charts come in the Classroom Charts Bundle above, so you can print, cut and hang them without drawing a thing.
Using alphabet posters and shapes posters
Alphabet posters and shapes posters are the charts that stay up the longest, so they should be easy to read from every seat.
Place alphabet posters at eye level for younger students, along a wall near the writing area. If you laminate the tracing posters, students can trace with a dry-erase marker, wipe the letter clean and try again. That makes one set last through many lessons.
Shapes posters work well on a bulletin board near the math center. Group the two-dimensional shapes on one side and the three-dimensional shapes on the other, so students see the difference. A cube, for example, has 6 faces, 12 edges and 8 vertices, and a reference chart is a good place to keep those counts in view.
Motivational charts for the wall
Some charts are about attitude rather than content. A short phrase on a bright poster can set the tone for the room.
- The Motivational Posters for Classroom packet has 62 poster pages in bright lettering, with phrases like Believe in Yourself, Work Hard and Never Give Up.
- The Classroom Motivational Posters for Students packet has 26 poster pages with boxed phrases of the same kind.
Hang a few at a time rather than all at once. A wall covered edge to edge stops being read.
Where to hang anchor charts and how to save wall space
Wall space runs out fast. A few habits keep a room readable.
- Group by subject. Put math charts in one area and writing charts in another.
- Rotate. Take down charts for finished units and store them in a folder or on a binder ring. Hang them again when the topic returns.
- Use a clip rail. A rail lets you flip charts like pages without taking each one down.
- Hang low for young students. A chart is only useful if the student can see it from where they sit.
- Give fixed charts a bulletin board. A board with a border gives alphabet or shapes sets a home that does not change.
Do not feel pressure to keep everything up all year. A smaller number of charts that students really use beats a crowded wall.
Keeping anchor charts in good shape
Paper charts curl, fade and tear. A few small steps help.
- Use tape that peels off cleanly, so corners do not rip.
- Laminate charts you plan to reuse, and use dry-erase markers on the ones you want to write on again.
- Take a photo of each built chart before you recycle it. You can recreate the same chart later from the photo.
- Write the date in a corner, so you know which charts are due for a refresh.
Frequently asked questions
How many anchor charts should a classroom have?
There is no set number. Hang the charts that students actually use, and take down the rest. A smaller wall that is read is better than a full wall that is ignored.
Should I draw anchor charts by hand or print them?
Do both. Draw charts that hold student thinking, such as a list the class builds together. Print charts that hold fixed facts, such as letters, shapes or a jobs list.
What size should an anchor chart be?
Large enough to read from the farthest seat. If students must walk up to read it, the lettering is too small.
How do I keep students using the charts?
Refer to them in your lessons. Say “Check the chart” before you give the answer, and ask a student to point to the step they need.